

Lemme be the first to say that I’m not an expert on this stuff. There are SaaS experts doing a way better job of this. However, here in our smaller database server community, it’s a different story – so I figured you might enjoy reading how this works behind the scenes, dear reader.
I recently decided to change the pricing model on our training videos. Before, you paid a fixed price (say $299) for 18 months access to a single video, or $699 for 18 months access to all of our training videos. The vast majority of buyers just bought everything, so I wanted to rework the pricing a little. (Seems like a good problem to have, but I think I’m missing out on people who would spend a smaller amount.)
We’re lucky enough to have an active mailing list with over 90k folks, so I was able to run a series of polls to small subsets (like 1k recipients per test) to see which pricing they would prefer. I’m going to share three of the tests I ran rather late in the process after I’d already learned a lot from prior experiments.
Pricing Test #1: The Lowball
Here’s an example of one of the tests I ran. I’m jokingly calling it the Lowball, but only in the context of this blog post. I ran much lower-price tests too, like $9/mo, to see if it would convert more buyers.

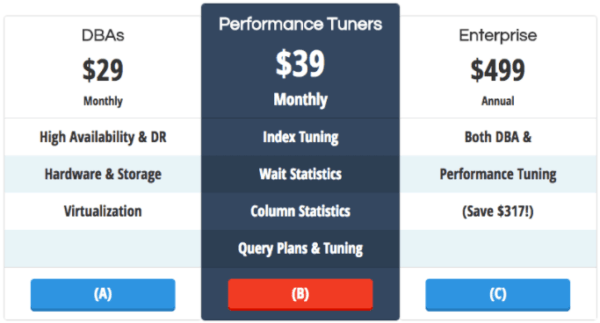
We sent this to readers and asked, “which one would you get your credit card out for, A, B, C, or none of the above?” (Yes, column B pops out brightly – that’s an example of another variable that I changed during different rounds of tests, including column titles of jobs vs video names vs aspirational titles, different savings displays of percent vs dollar amount, etc.)
You’ll notice that this poll is a bit of a hybrid: two of the answers are monthly subscriptions, and one of them is an annual prepayment. By the time I ran this test, prior tests had already determined that we have two types of customers:
- People who expense the training and just want to swipe their card once to get everything, and
- A price-sensitive audience who pays for the training out of their own pocket, and doesn’t want to fork over a large up-front cost
Here’s how they answered – note that there’s much more data here than what the survey-taker saw – this is the analysis side of the work:


Out of the 3 tests covered in this blog post, this one got the highest percentage of buyers, 88%. Remember how I said I ran even lower-priced tests, like $9/mo? If 100% of the responders bought at $9/mo, 136 buyers * $9/mo * 12 months = $14,688 annual revenue, or a $40k loss from the above test. Going that cheap doesn’t make sense.
A Word About Responses and Response Rates: “Distorted”
This survey was sent to about 2,000 folks, and after 24 hours, 136 responses came in (6.8%). 136 sounds like an awfully small number to make a decision on, and it is, but if you’re going to run a lot of tests, you don’t want to keep re-testing the same audience members. I was polling about 50k of our 90k subscribers, and those 50k were chosen for specific reasons.
While 88% of responses said they’d buy, that doesn’t really mean much without a credit card involved. That’s why in some SaaS pricing tests, you’ll hear the company actually let people sign up with their answer. That’s also why companies continue to run A/B pricing tests after going live, and measure results with real revenue numbers. There’s even WordPress plugins to help with A/B testing.
Our price tests will get more accurate after we go live, but I still needed basic numbers to go live with. Anyhoo, back to our testing.
Pricing Test #2: Everything Only
I don’t like the way the next test looks – it’s visually imbalanced – but whatever:

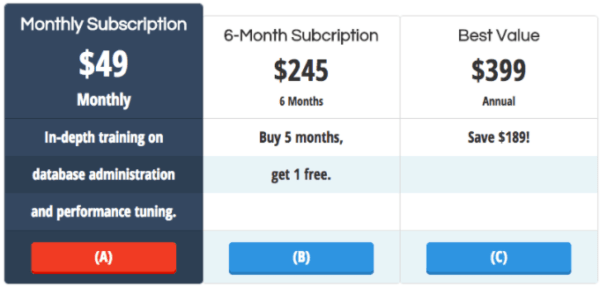
In this one, there was no DBA-only or performance-only option: you just had different ways to subscribe to everything. (It’s the Pluralsight model.) Drumroll please:


Compared to the prior test, this one had less buyers (82%, down from 88%) but a higher average spend per buyer ($491, up from $461.)
That means that if 1,000 people hit the sales page, then:
- Test 1 = 1,000 * 88% buyers * $461 annual spend = $405,680
- Test 2 = 1,000 * 82% buyers * $491 annual spend = $402,620
It would seem at first glance that test 1 would be the winner, but they’re both pretty close. Another factor is that in test 1, 54% of the buyers were monthly subscribers, which means lower up-front cash flow, and a higher chance of monthly churn. In test 2, only 34% of the subscribers were monthly.
Price Test #3: The Highball
To show another variation example, let’s take test #1, and just raise the prices across the board. Instead of $29/$39/$499, let’s do $39/$49/$599, so it’s the highball of this set of 3 price tests:

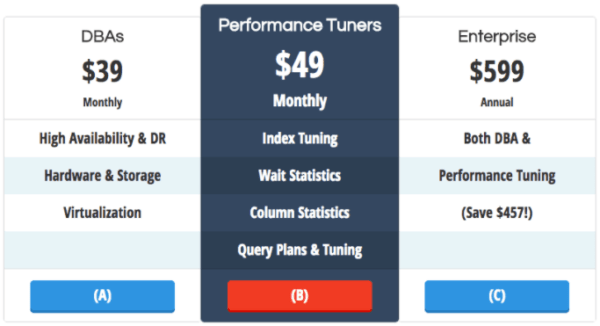
Now remember, readers don’t have to get out a credit card, so they’re less price-sensitive during free email surveys. With that in mind:

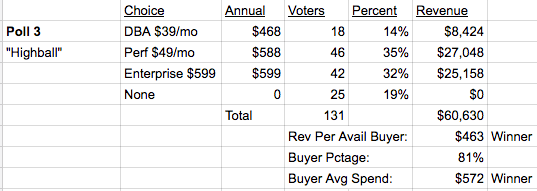
Even though there’s no credit card required here, the number of “None” answers went up from 13% to 19% – there’s real price resistance as you up the costs. Less people buy here – but it’s not a dramatic drop, down from 88% and 82% in other tests to 81% here.
However, because the buyer average annual spend is up dramatically here to $572, it wins:
- Test 1 = 1,000 * 88% buyers * $461 annual spend = $405,680
- Test 2 = 1,000 * 82% buyers * $491 annual spend = $402,620
- Test 3 = 1,000 * 81% buyers * $572 annual spend = $463,320
What It All Means
Ever since we introduced the Everything Bundle, it’s simply dominated our sales at 80%+ of revenue. In these polls, though, the equivalent option (1 year of everything) consistently gets 32-35% of the votes. That could mean one of a few things:
- Instead of buying the Everything Bundle, people might switch to spending less on a monthly subscription (which could be bad for our business), or
- The core 32-35% of top-end responses here represent the people who were always buying the Everything Bundle, and the new 50% responses jumping for the monthly bundles would indeed represent entirely new buyers we didn’t get before (which would be awesome for our business), or
- People are just clicking “yeah I’d buy a monthly subscription” when they really won’t
To figure that out, we also polled our existing Everything Bundle owners, plus folks who only bought 1-2 of our individual training videos.
For launch, we ended up going with Price Test #3, but with discount coupons available to loyal email readers (especially those who helped us out with the surveys.)
I could go on for pages about the work involved, and I absolutely love this kind of thing, but hopefully this gives you an idea of what it’s like to run your own sales at scale.
To learn more about price tests, check out:
- The Subscription Pricing Journey for a big-picture explanation of variations like free trials, billing frequencies, regional pricing, add-ons, usage fees
- Constructing a Pricing Strategy for Subscriptions for a more technical analysis with graphs showing the kinds of things big businesses do to set pricing
- Podcast: Subscription Pricing Models episode of the phenomenal Startups for the Rest Of Us podcast – I would recommend listening to this rather than reading the transcript, because it’s a big wall o’ text with no headers.
- Slide deck: Pricing Strategy with Subscriptions targeted at bigger businesses than you and me, dear reader, but fun to dig into