

Every year, Microsoft MVPs have to fill out some paperwork describing what they did on their summer vacation. Each time I do this, the numbers boggle my mind, so I’m sharing some of the fun ones with you data junkies. (These numbers aren’t necessarily the ones I use on my community contribution forms because they reflect things the whole company is doing, not just me.)
YouTube Channel Stats
We record our weekly webcasts and post them up on our YouTube channel. You people continue to watch them in crazy numbers:
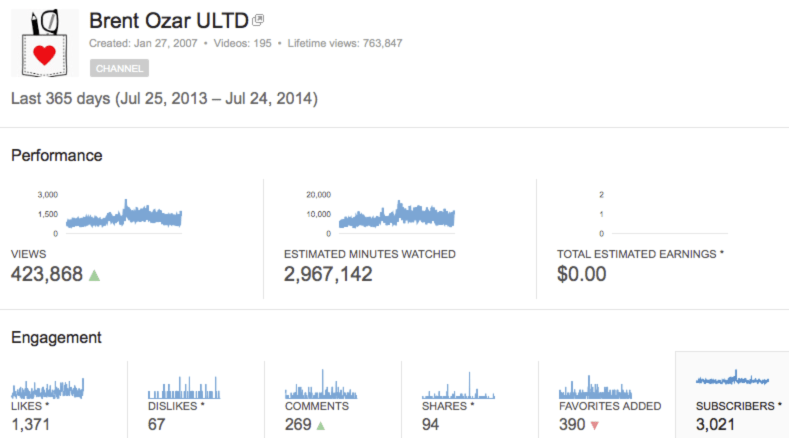
That’s 49,452 hours of video watching time – more than double our numbers from last year. That’s insane. It’s not like we’re even trying to do videos to get more hits – we’re just talking about SQL Server stuff we like to talk about.
I had to laugh that our “Dislikes” number has tripled (from 23 last year). Out of 423,868 views, I’m actually kinda surprised we only got 67 dislikes. Can’t please all of the people all of the time, but pleasing 99.98% seems pretty good. (Hey, we’ve got three nines.)
The “subscribers” number is only over the last 365 days – we’re currently at 5,714 subscribers, which is pretty amazing to me because I don’t even subscribe to YouTube channels. I just search for individual videos and watch ’em. There’s clearly a big audience out there that likes to subscribe to this stuff.
The “Total Estimated Earnings: $0.00” is genius – YouTube is owned by Google, and they’re basically taunting you right from the dashboard. “Hey, come put Google ads on your videos, and you could be making real money.” Well, yeah, sure, but then people would stop subscribing, because few people want to see SQL Server training with ads slapped all over it.
DBAreactions Statistics
My goofy little side project continues to rock on. I try to sneak in a lot of educational material in here to inject learning in fun ways. Seems to be working. I have no idea what my end goal is with this thing. When I first pulled this up, I was a little disconcerted by the downward trend:
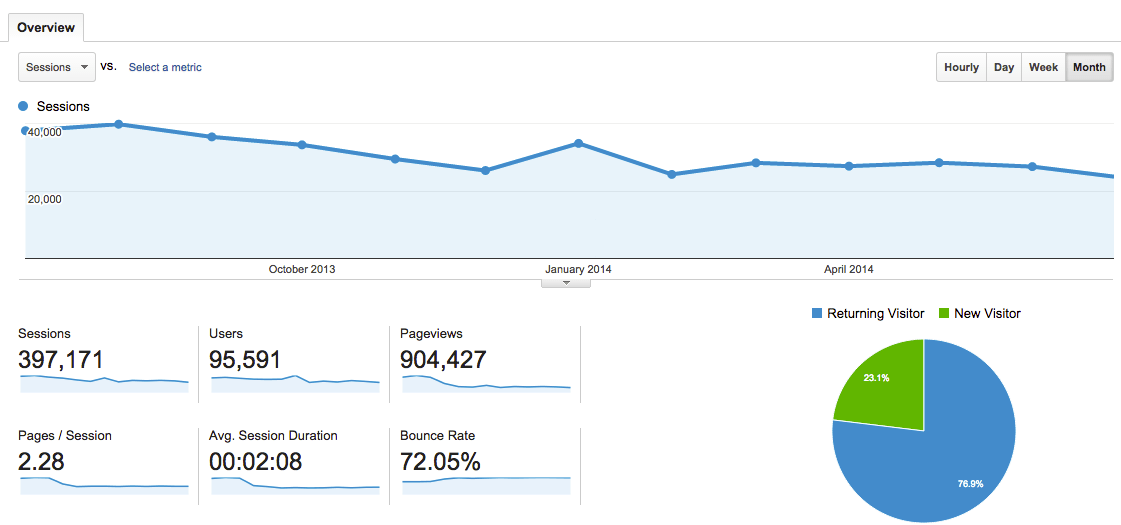
But holy cow, it’s still up double from last year’s launch – 397,171 sessions?!? That’s about a thousand per day. And 95,591 users?!? There’s A HUNDRED THOUSAND PEOPLE who like our goofy database jokes? Wow. My mind, it is boggled.
Where are these people coming from?

Most come from the @DBAreactions Twitter account, but a surprising number come from Facebook. How is this even happening? People are sharing reactions on Facebook, with links back to DBAreactions.com? Wow.
And Feedly? So evidently I’m not the only person who uses Feedly to stay on top of my favorite sites (it’s a great replacement for Google Reader) but wow.
But the one that really makes me chuckle is Chat.StackExchange.com. Somebody must have written a bot to automatically fetch the most recent DBAreactions and post them into the chat rooms.
Ozar.me Analytics
In 2014, I resolved to publish one solid post every Tuesday. (Some Tuesdays, like this one, are less solid than others.) I’ve always seen myself as a journalist for the SQL Server community, and I started treating my personal blog as my journalism project again. I don’t write for metrics, but it’s interesting that readers appear to appreciate the work I’m putting into it:
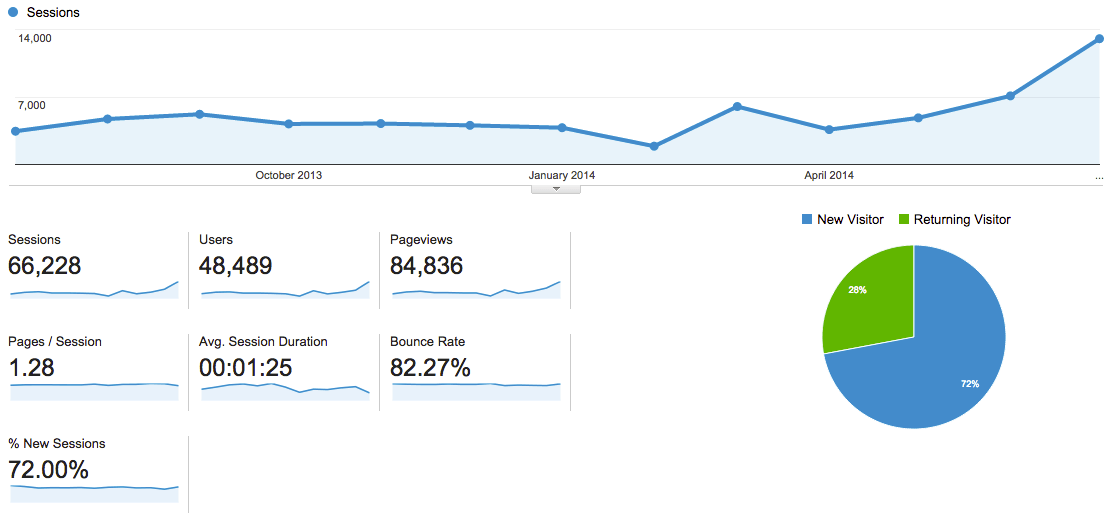
I’m happy with that growth curve, but anytime I need a sense of perspective, I look at the annual analytics for BrentOzar.com:
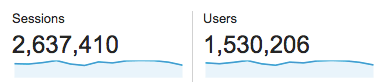
Uh, yeah. Ozar.me is a fun side project, but …yeah.
Twitter Analytics
I never looked at this stuff before, but hey, as long as we’re poking around in data, let’s hit Twitter Analytics for @BrentO:

I have no idea what this means, but I recently started using Buffer to selectively share some of my favorite posts from over time. I’ve got a huuuuge bookmark collection of things I find inspiring, stuff I go back and re-read later. Figured I’d start dribbling those out to the public periodically too. People seem to like it – those tweets actually get MORE engagements than my actual stream-of-consciousness tweets. Go figure.
Followers are trending up:

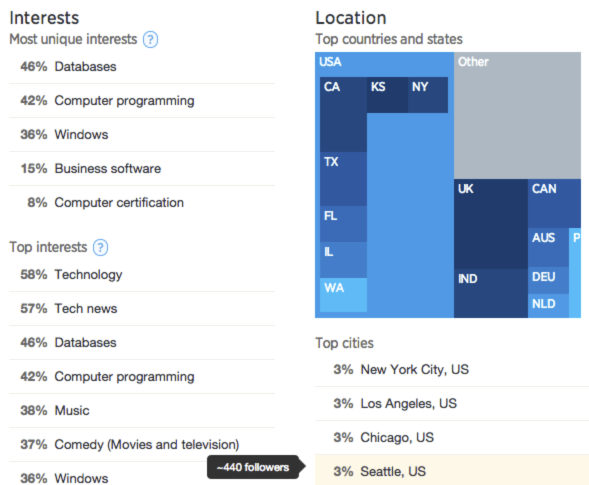
Cool. And the people who follow me are interested in databases, programming, and comedy:
And it’s not exactly a metric, but what have I been talking about lately? Tweet Topic Explorer is a neat little tool that grabs your recent tweets and busts you for overusing phrases:


I laugh a lot. That sums up this year pretty well.
What Does It All Mean?
This isn’t about shoegazing or bragging. It’s about inspiring you and showing you a way forward.
Building a following is like making a snowball. It’s easy to pack a small snowball quickly. It’s a little harder to roll a snowball uphill and multiply it. It’s relatively easy to roll a snowball downhill, but it can get away from you and go into directions you don’t expect. This isn’t rocket science, but you do have to put some manual work into it. Even when the snowball is rolling downhill – and your network starts growing on its own once you hit a certain mass – you have to curate it.
A big audience means you can launch big projects. When we ran a 30% off sale last month to celebrate the launch of our 2015 training classes, we sold tens of thousands of dollars of training videos in the span of a few days. We won’t go to Pat Flynn levels of detail in describing where our revenue comes from, but this stuff really does work. The challenge is that unless you put a lot of work into improving your conversion rate (the percentage of people willing to hand you money), you’re going to have a tough time making a living.
Next time, I’ll talk about building a brand just for the sake of growing a big audience.